My eyes were glued to the monitor, fingers doing a tap dance on the F6 key periodically using F5 and F8 too. A colleague walked over to my cubicle and asked me what I was doing. After giving him a I-didn't-want-to-be-disturbed look, I told him I was debugging a server side Java code. He was surprized. He knew how to debug a stand alone Java application using Eclipse. It was as simple as running the application through the Debug mode, introducing a breakpoint and changing the perspective of Eclipse to Debug. He was not aware that we could do the same on a code getting executed inside an application server.
Simple ... I told him. The only change required is to setup a Remote Java application in Eclipse and modify the start up scripts of your application sever. Piece of cake !
We use Websphere, Weblogic and JBoss applicaiton servers the most in our projects. I have listed down steps for configuring Eclipse and these application servers for debugging your J2EE components. Hope it saves your time spent in restart, recompile, redeploy of J2EE components. Finding a problem is very easy when you have the power of debugger !
Weblogic 9.2:
- Open the startWebLogic.cmd file present in the bin folder withing your user domain.
- Search for text -Xrunjdwp in this cmd file. If you find one, stick to modifying it. If you don't find one, then you will need to add the following line:
- Some advice to set the debug parameters in the DEBUG_OPTS variable. But I prefer sticking to the JAVA_OPTIONS as these are definitely put on the command for launching the weblogic application server.
- The address=1044 tells the application server to connect the debugger over 1044 port. In case the port is in user, change it to some other port like 7002 or 9001 whichever is free.
- The suspend=n tells the application server to continue with the startup and execution even if no debugger is attached
- If the value of suspend attribute is changed to y i.e. suspend=y, then the application server's JVM starts in suspended mode and stays suspended till some debugger gets attached to it.
- Start Weblogic. You should see the text highlighted in the image above on your console too.

JBoss 4.0.5 GA :
- Open the run.bat file present in the bin directory of JBoss installation
- Look for the following text :
rem JPDA options. Uncomment and modify as appropriate to enable remote debugging.
rem set JAVA_OPTS=-Xdebug -Xrunjdwp:transport=dt_socket,address=8787,server=y,suspend=y %JAVA_OPTS%
- If you find it, then uncomment the set JAVA_OPTS by removing the rem keyword.
- If you do not find the text, add the following text :
set JAVA_OPTS=-Xdebug -Xrunjdwp:transport=dt_socket,address=1044,server=y,suspend=y %JAVA_OPTS%
- The address=1044 tells the application server to connect the debugger over 1044 port. In case the port is in user, change it to some other port like 7002 or 9001 whichever is free.
- The suspend=n tells the application server to continue with the startup and execution even if no debugger is attached.
- If the value of suspend attribute is changed to y i.e. suspend=y, then the application server's JVM starts in suspended mode and stays suspended till some debugger gets attached to it

- Start JBoss. You should see the text as shown in the image
Websphere 6.1.0.13:
- Open the admin console of Websphere. This is generally https://machine-name:9043/ibm/console
- Login using correct credentials
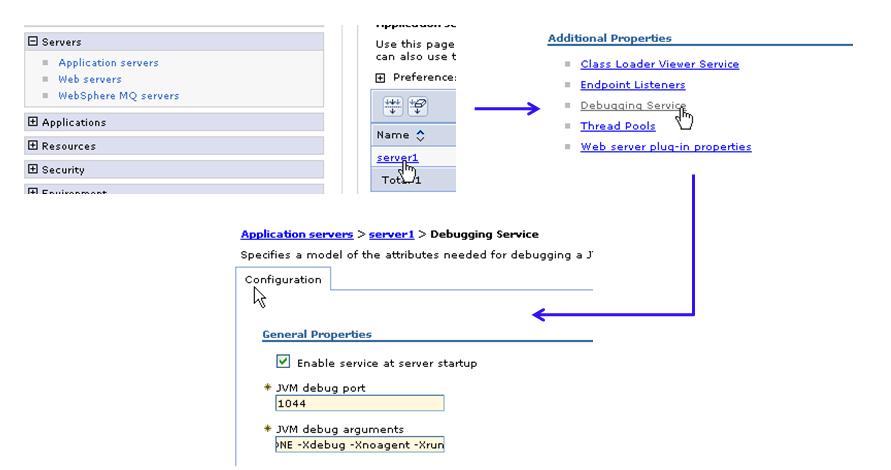
- On the left navigation pane, open Servers --> Application Servers. On the right pane, click on your server name that needs to be started up in debug mode.
- This takes you to the Configuration tab. Scroll to the botton to find a section for Additional Properties. Click on the Debugging Services link.
- Change the JVM debug port to 1044.
- Append the following text to the JVM debug arguments:
- The address=1044 tells the application server to connect the debugger over 1044 port. In case the port is in user, change it to some other port like 7002 or 9001 whichever is free
- The suspend=n tells the application server to continue with the startup and execution even if no debugger is attached.
- If the value of suspend attribute is changed to y i.e. suspend=y, then the application server's JVM starts in suspended mode and stays suspended till some debugger gets attached to it.
- Click on OK button.
- Restart the Websphere instance
Eclipse 3.3.0 :
- Start one of the application server (Weblogic/Websphere/JBOSS)
- Launch eclipse. Change to the Debug perspective. Open the Debug Dialog.
- Select the Remote Java Application and Click on New Launch configuration (the button on the top left)
- Give suitable name for this debug app ( I have given it same as application server name i.e. JBOSS)
- Select the project which you want to debug. This could be your EJB, Webservice, Servlet etc
- Give the hostname as the machine name where the application server is running. The port number should match the value of the address attribute set in the start up script off application server (we have provided the address in the above sections)

- Click on apply. Then click on Debug. You should see multiple Java threads listed in the Debug perspective.

Now you can insert break points in the project and debug the J2EE components deployed in application server.
Happy debugging !


5 comments:
Amey,
Thank you for the concise instructions. I was able to setup my Eclipse + WebLogic 9.2 for remote debugging easily.
Valli
The suggestion which you provided to configure remote debugging with eclipse using weblogic app server. But i am getting the following error after the configuration you mentioned.
Failed to connect to remote VM. Connection refused.
Connection refused: connect
Hi Anony ....
In case you get connection refused, there are two things you might want to check
1. Is the port number correct
2. If the app server is running on same machine as eclipse, try using localhost instead of machine name. If this works, then maybe you need to use fully qualified machine name i.e. machine name along with complete address like .net.yahoo.co etc etc
Nice article ,Remote Debugging was the single most feature which convinced me to migrate from Netbeans to Eclipse.
Thanks
Javin
How to setup remote debugging in Eclipse
Nice article ,Remote Debugging was the single most feature which convinced me to migrate from Netbeans to Eclipse.
Thanks
Javin
How to setup remote debugging in Eclipse
Post a Comment